Class of 2023 Post High School Acceptance Map (As of 4/5/2023)
Blue = 1 acceptances Yellow = 8-11 acceptances
Cyan = 2-3 acceptances Orange = 12-15 acceptances
Green= 4-7 acceptances Red = 16+ acceptances
Cyan = 2-3 acceptances Orange = 12-15 acceptances
Green= 4-7 acceptances Red = 16+ acceptances
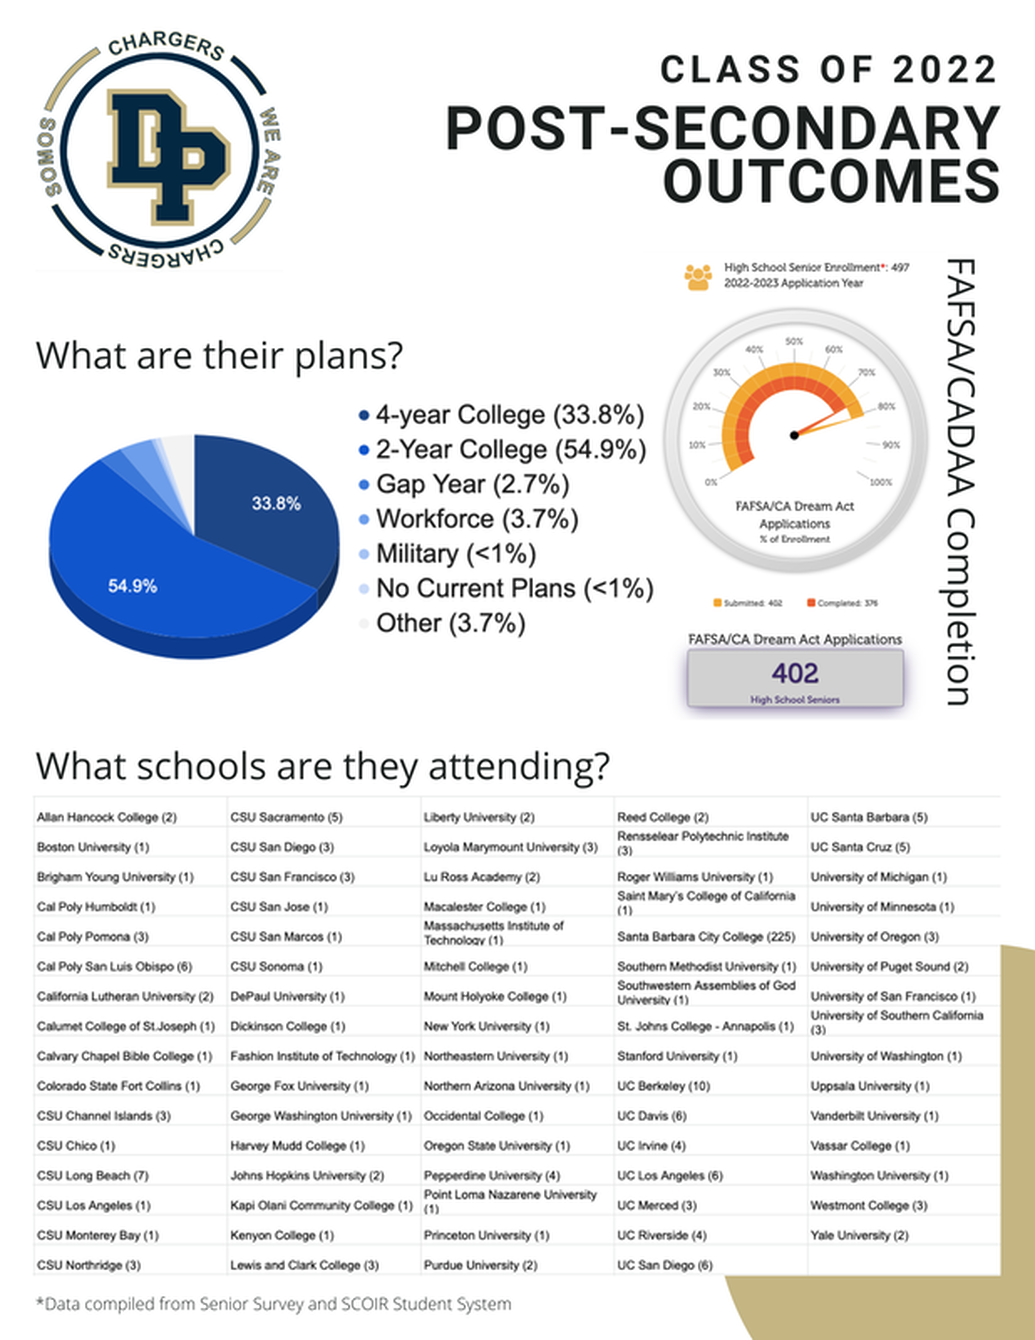
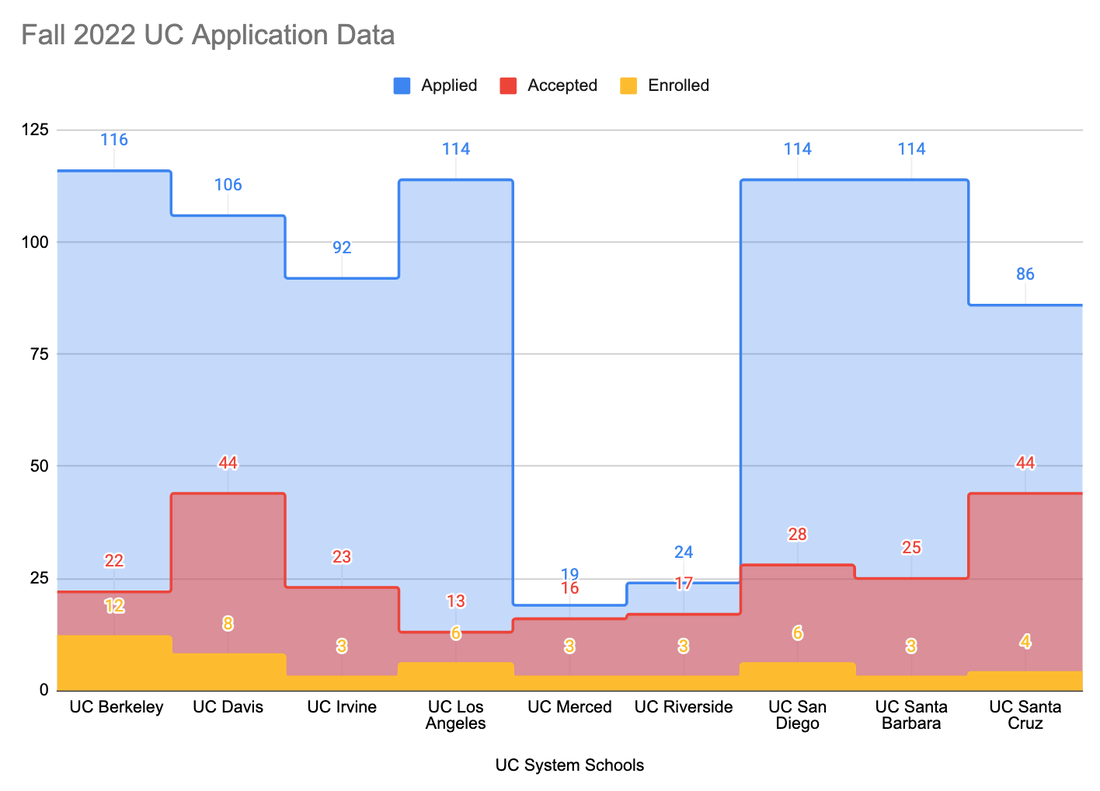
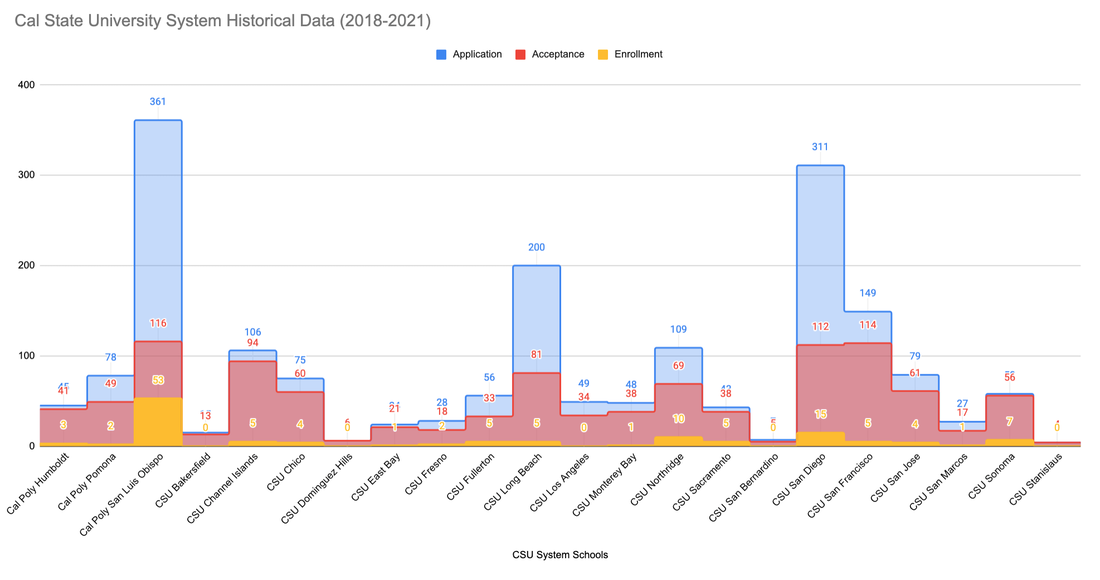
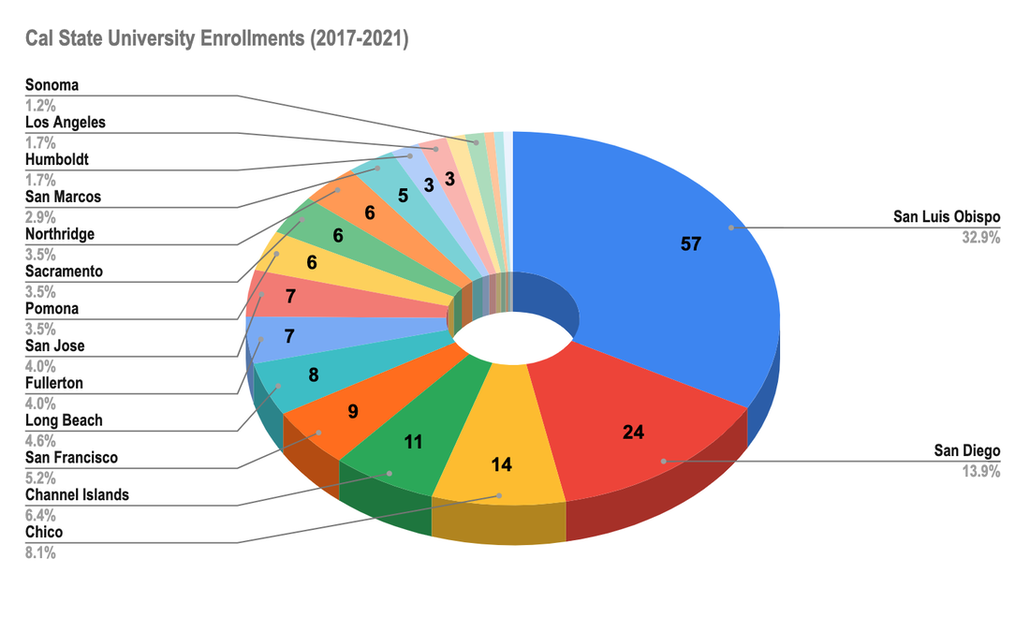
Class of 2022 Acceptance Data
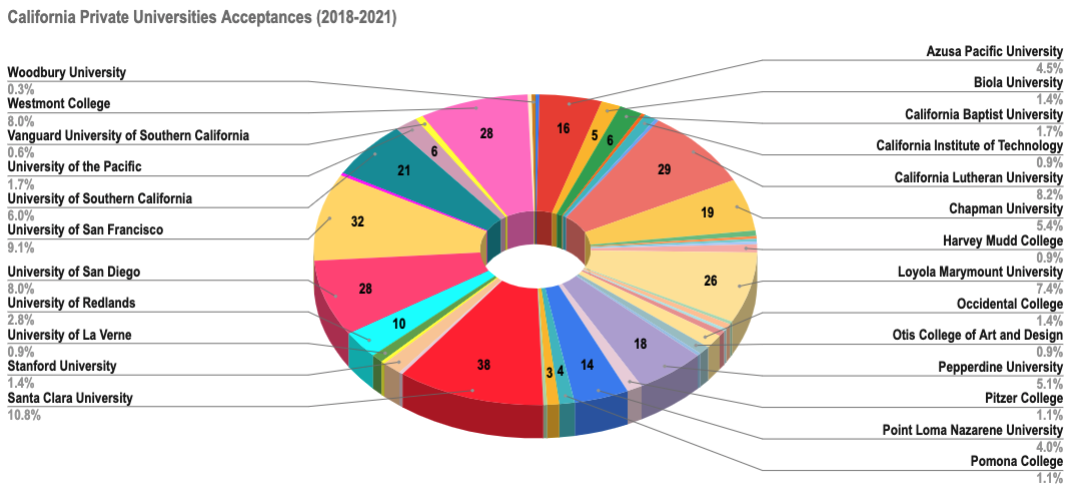
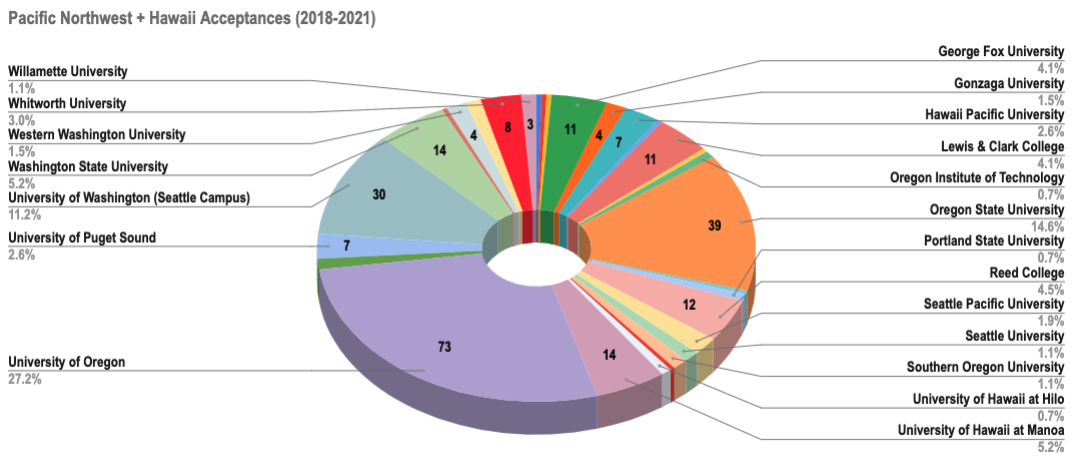
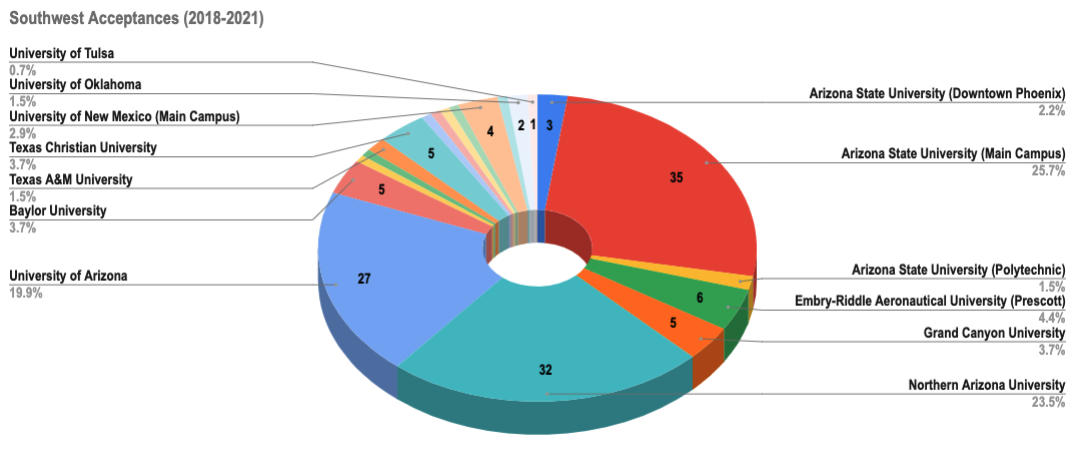
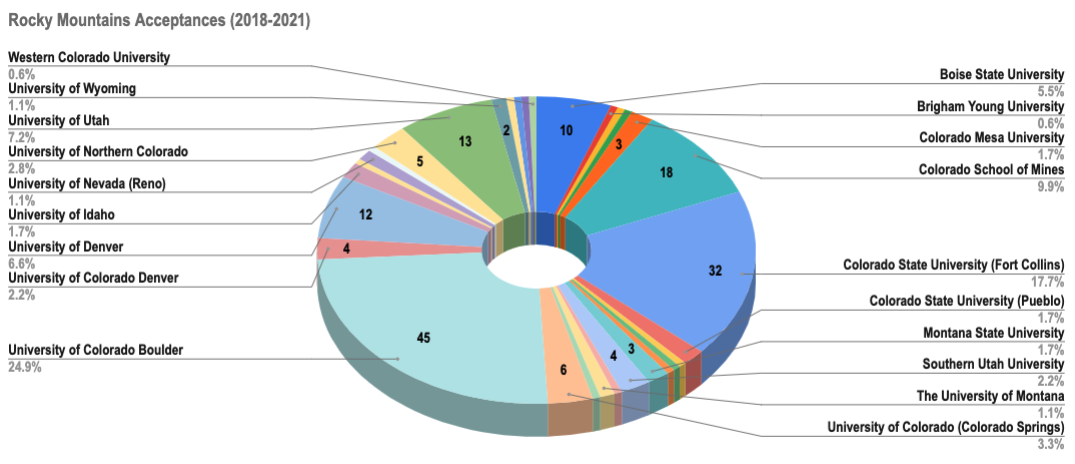
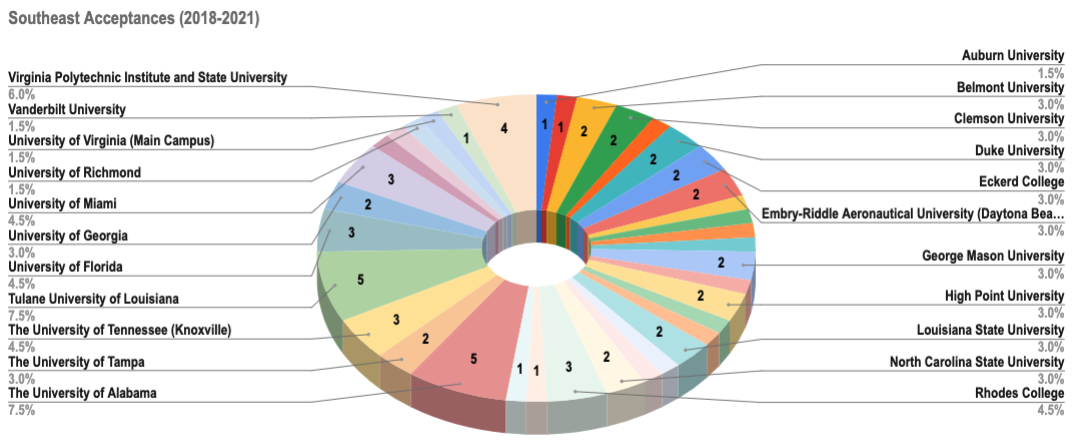
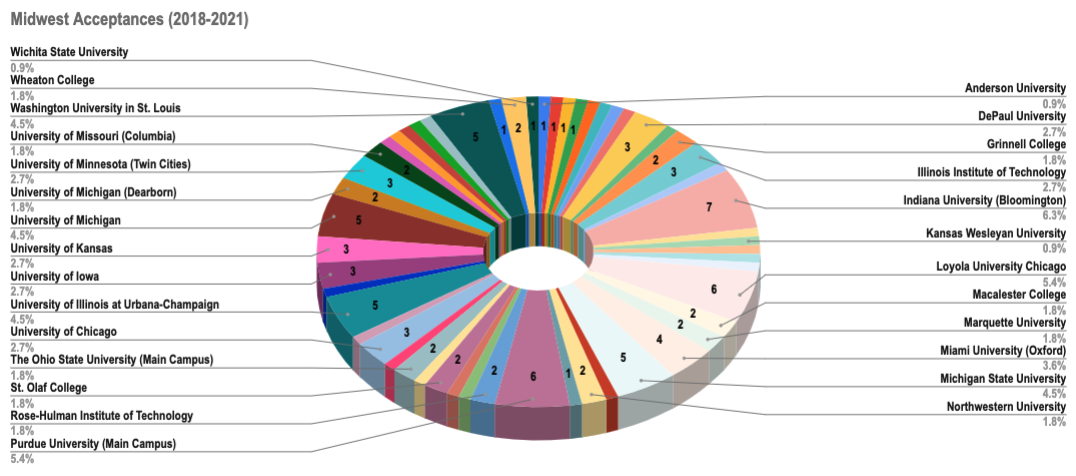
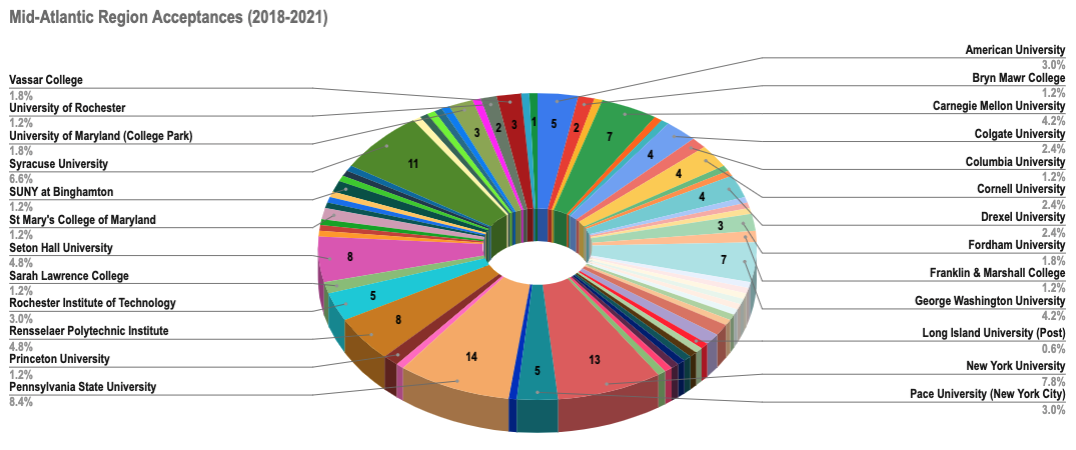
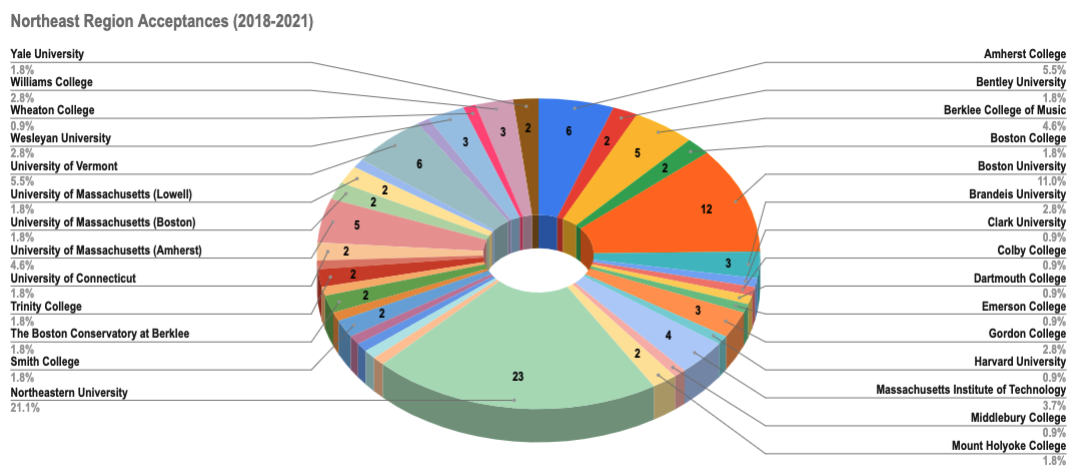
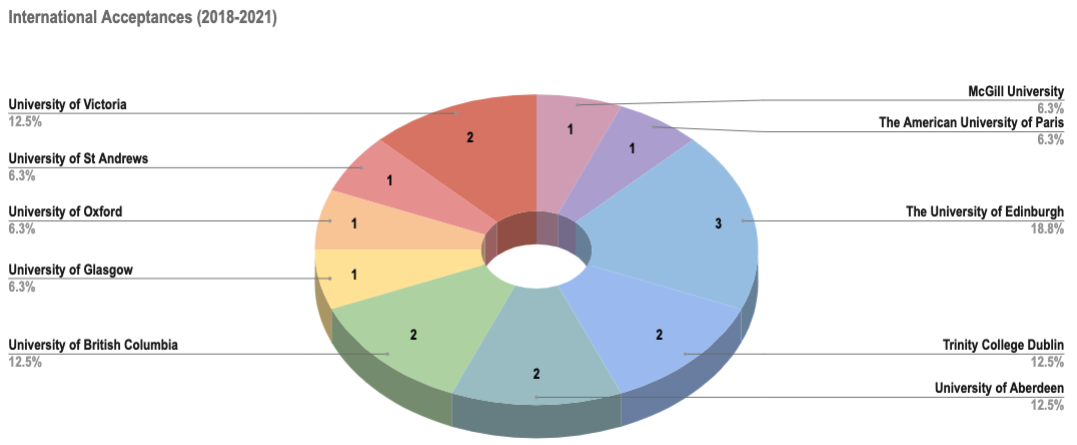
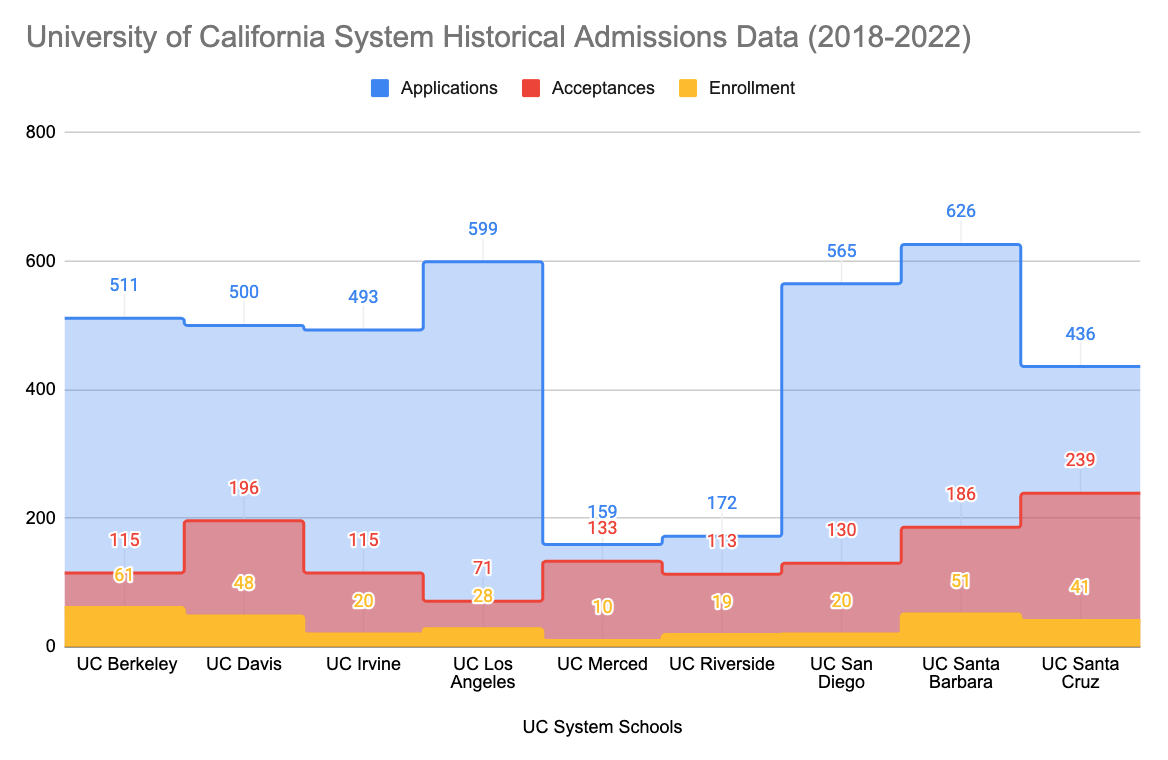
Historical Acceptance data
*Percentage displayed = total percentage acceptance out of the specific region
*California Public Acceptance data obtained from UC and CSU Office of Research
*California Public Acceptance data obtained from UC and CSU Office of Research
*All Private College/University and Out of State Public University data based on self-reported Senior Survey data in our SCOIR platform.